Which U.S. counties face the biggest danger from Earth’s most powerful storms?
With climate experts forecasting a “borderline hyperactive” hurricane season, Gutter Gnome ranked 2023′s Most Hurricane-Vulnerable Counties.
Recommended Videos
The study combined hurricane risk assessments by the National Center for Disaster Preparedness (NCDP) with 10 years of historical storm data and financial impact projections from government agencies.
Stay up to date on hurricane season with Tropics Watch:
See how over 300 counties might fare this hurricane season in the ranking.

Gutter Gnome
In the Eye of the Storm: The 5 Most Vulnerable Counties
The Big Picture
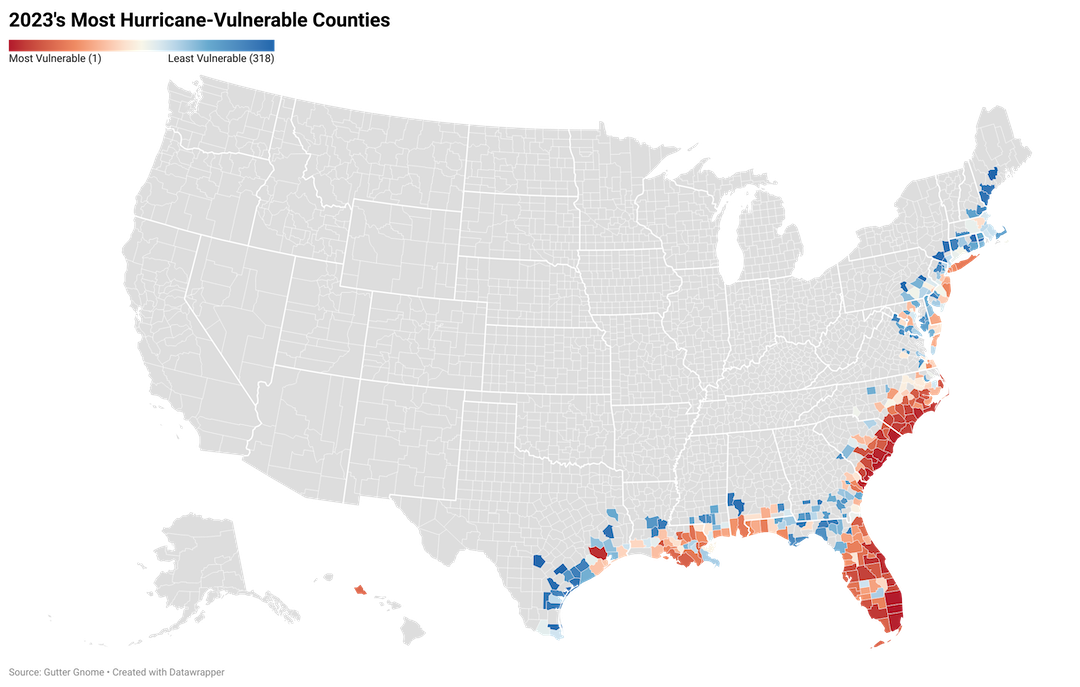
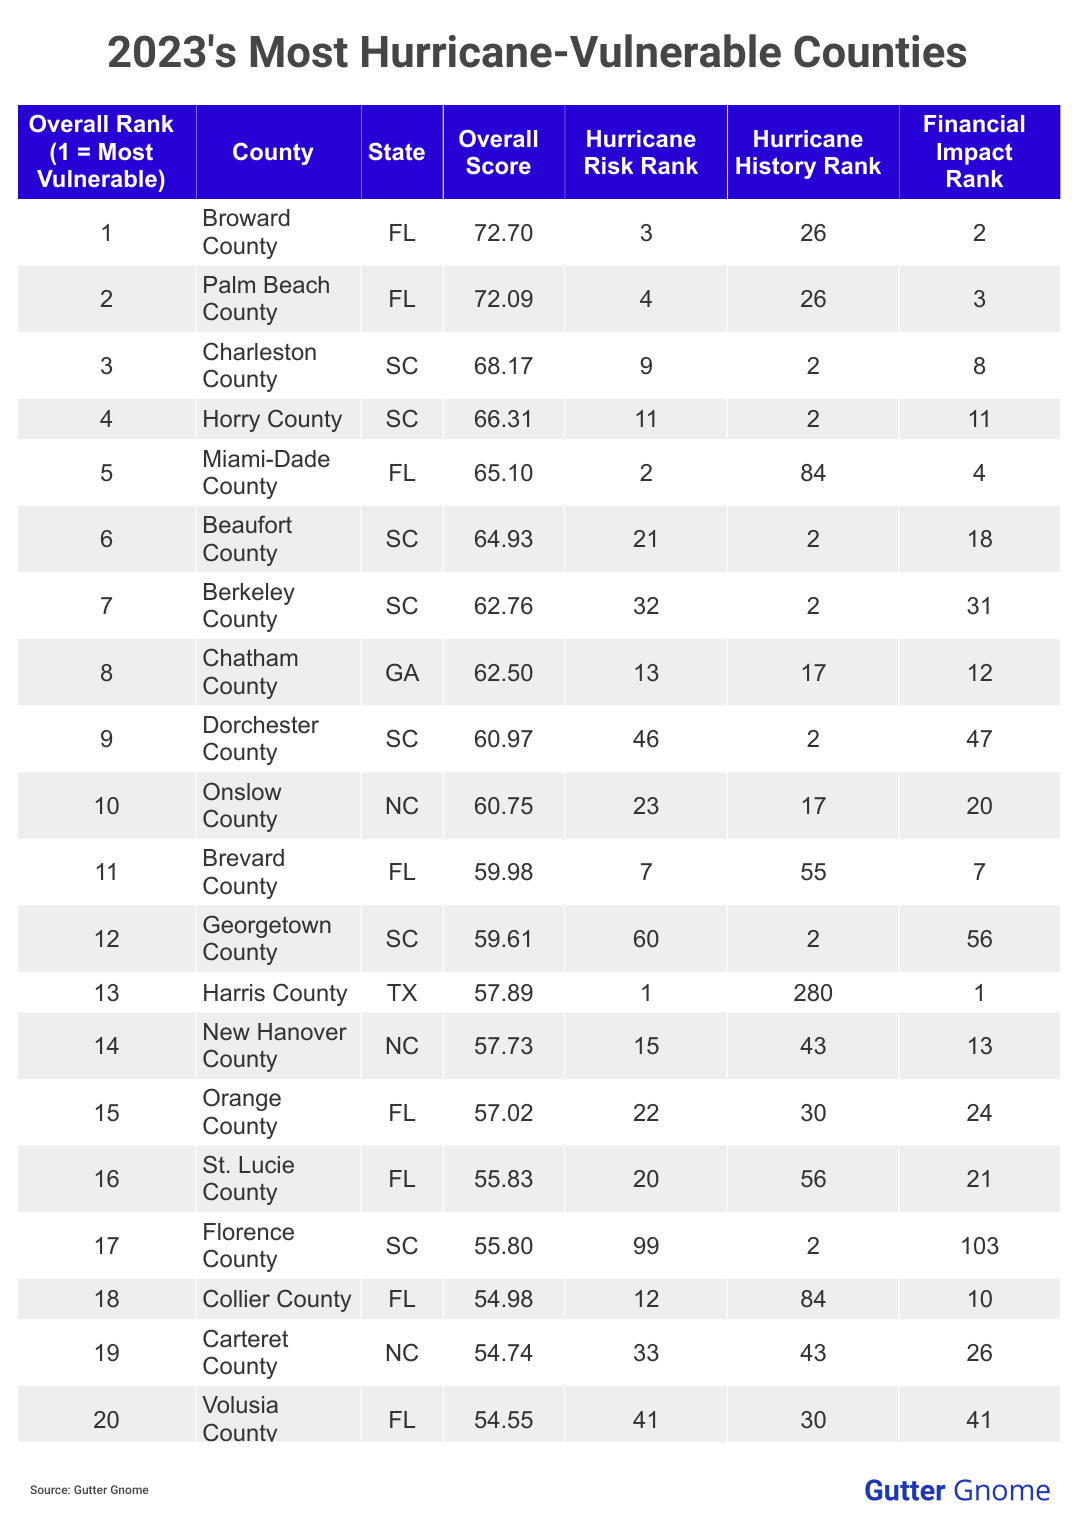
The Sunshine State might also be called the Hurricane State, as two of its counties, Broward and Palm Beach, occupy the two worst spots for hurricane risk. It's also no surprise that the Southeast has the biggest hurricane vulnerability, the ranking confirms.
In fact, the 10% most susceptible counties are made up almost entirely of only three states: Florida, South Carolina, and North Carolina. Chatham County, Georgia (No. 8), and Harris County, Texas (No. 13), are the lone exceptions in this group.
Conversely, much of New England and the Texas coast are the calmest regions. Hurricanes tend to be rare in these areas and therefore face low risk of physical and monetary damages.
Check out the rankings on each of the five worst-performing counties.
No. 1: Broward County, Florida | Overall Score: 72.70
Risk: 3
Hurricane History: 26
Financial Impact: 2
No. 2: Palm Beach County, Florida | Overall Score: 72.09
Risk: 4
Hurricane History: 26
Financial Impact: 3
No. 3: Charleston County, South Carolina | Overall Score: 68.17
Risk: 9
Hurricane History: 2
Financial Impact: 8
No. 4: Horry County, South Carolina | Overall Score: 66.31
Risk: 11
Hurricane History: 2
Financial Impact: 11
No. 5: Miami-Dade County, Florida | Overall Score: 65.10
Risk: 2
Hurricane History: 84
Financial Impact: 4

Gutter Gnome
Stormy Stats
Calm Before the Storm
- Although most hurricane-vulnerable counties display equally high risk and history of hurricane activity and financial loss, some counties buck this trend. They include counties like Florence, South Carolina (No. 17), and Columbus, North Carolina (No. 22), which are rated more moderately in terms of risk by NCDP and FEMA but have experienced significantly more hurricanes over the past decade.
All Quiet on the Southern Front
- Some counties synonymous with hurricane disasters didn't rank as high — more vulnerable, that is — despite very high risk of storms and loss. Lee County, Florida (No. 36), for instance, was devastated by Hurricane Ian in 2022. Apart from one other Category 5, Irma in 2017, Lee County has had a relatively calm decade. Likewise, Orleans Parish, Louisiana (No. 61), was leveled by Hurricane Katrina. That was back in 2005 — the past 10 years have been more peaceful.
Inland ≠ Immune
- While some counties might be farther from the coast, they are not necessarily safe from hurricanes or their effects. Richland County, South Carolina (No. 112 overall), and Wake County, North Carolina (No. 93), for instance, both lie more than 100 miles from the Atlantic Coast but show above-average risk and active hurricane histories. Typical hurricanes cover an area of about 100 miles but can be as wide as 300 miles.
When It Rains, It Pours
- Although hurricanes are rare in the Middle Texas Coast, some arrive with intense force. When Hurricane Harvey crossed over the area in 2017, a record 1 trillion gallons of water fell over Harris County over four days. This is why Harris County received the highest risk assessment and financial loss estimate — from separate research entities — despite a relatively quiet decade. Prior to Harvey, Celia was the last major hurricane to hit the area — in 1970.
Costliest Counties
- Of the 10 counties with the highest expected annual financial loss from hurricanes, eight are in Florida. Collectively, those eight counties represent over $4.3 billion of losses, though actual losses often are significantly higher. Harris County, Texas (No. 13 overall) — covering Houston, the fourth largest U.S. metro area — and Charleston County, South Carolina (No. 3), make up the other two counties. Harris County leads this entire group and represents potential losses greater than $1.1 billion.
Categorically Catastrophic
- Over the past decade, four states — Florida, Georgia, North Carolina, and South Carolina — each have been hit or affected by four Category 5 hurricanes between 2013 and 2022, the most among all the counties the study ranked. However, only one Georgia county, Chatham (No. 8 overall), was effectively impacted by a Category 5 storm.
Geographic Differences
- Honolulu County, Hawaii (No. 53 overall), is the only Pacific county in the ranking and registered the most hurricane activity, with 12 in the past 10 years. In this region, hurricanes — as tropical cyclones are known on the Atlantic Coast — are called "typhoons." They are the same weather phenomenon.

Canva
Hurricanes by the Numbers
- Minimum wind speed for a Category 1 vs. Category 5 hurricane
- Categories of hurricanes — based on wind speed — on the Saffir-Simpson Scale
- Minimum temperature (in Fahrenheit) of water required for a hurricane to form
- Number of miles that a hurricane can cover
- Width of a typical hurricane eye, in miles
- Number of hurricanes — aka "typhoons" and "tropical cyclones" — that can form around the world each year
- Number of names issued by the World Meteorological Organization to give tropical storms at the start of every hurricane season
Collateral Damage
- Number of feet above sea level that water rises over land in a typical storm surge
- Number of hurricane-related deaths caused by storm surges
- Highest number of tornadoes spawned by a single tropical cyclone, Hurricane Ivan (2004) — across 9 states
- Combined total damage inflicted by the 10 costliest hurricanes in U.S. history
- Combined total cost of 360 billion-dollar weather and climate disasters since 1980, as of July 11, 2023
- Most active Atlantic hurricane season to date — by number of named storms, 30, including 14 hurricanes
- Most active Atlantic hurricane season to date — by number of hurricanes, 15
- Number of days of longest cyclone to touch the U.S., Hurricane/Typhoon John in 1994
- Number of days of longest tropical cyclone in global history, Cyclone Freddy in 2023
- Highest Accumulated Cyclone Energy (ACE) — measuring cyclone strength — recorded for a single tropical cyclone worldwide, Cyclone Freddy in 2023
5 Costliest Hurricanes
- Hurricane Katrina (2005): $193.8 Billion
- Hurricane Harvey (2017): $153.8 Billion
- Hurricane Ian (2022): $115.2 Billion
- Hurricane Maria (2017): $110.7 Billion
- Hurricane Sandy (2012): $85.2 Billion
5 Deadliest Hurricanes
- Great Galveston Hurricane (1900): 8,000 Deaths
- Hurricane Maria (2017): 2,975 Deaths
- San Felipe-Okeechobee Hurricane (1928): 2,500 Deaths
- Hurricane Katrina (2005): 1,207 Deaths
- Cheniere Caminada Hurricane (1893): 1,100
Behind the Ranking
First, Gutter Gnome determined the factors (metrics) that are most relevant to rank the Most Hurricane-Vulnerable Counties. A weight was assigned to each factor based on its importance and the factors were grouped into three categories: Risk, Hurricane History, and Financial Impact. The categories, factors, and their weights are listed in the table below.
For each of 318 U.S. counties with a Hurricane Risk Score determined by the National Center for Disaster Preparedness (NCDP), Gutter Gnome then gathered data on each factor from the Federal Emergency Management Agency (FEMA), National Center for Disaster Preparedness (NCDP), and National Oceanic and Atmospheric Administration (NOAA).
Finally, scores were calculated (out of 100 points) for each county to determine its rank in each factor, each category, and overall. A county's Overall Score is the average of its scores across all factors and categories. The highest Overall Score ranked "Most Vulnerable" (No. 1) and the lowest "Least Vulnerable" (No. 318).
Notes
- The "Least Vulnerable" among individual factors may not be No. 318 due to ties.
- Although some hurricanes did not directly cross over a particular county, hurricanes within 100 miles (the average coverage area of a typical hurricane) of the county's center were counted in its history, as it still may have been impacted by those storms. The study therefore included all hurricanes that made landfall within 100 miles of each county's center.
- NCDP's dataset does not currently include Hurricane Risk data for the Eastern Pacific Basin. West Coast counties therefore were excluded from the sample, as well.
This story was produced by Gutter Gnome and reviewed and distributed by Stacker Media.